Use MongoDB to expand Chrome Dev Tools
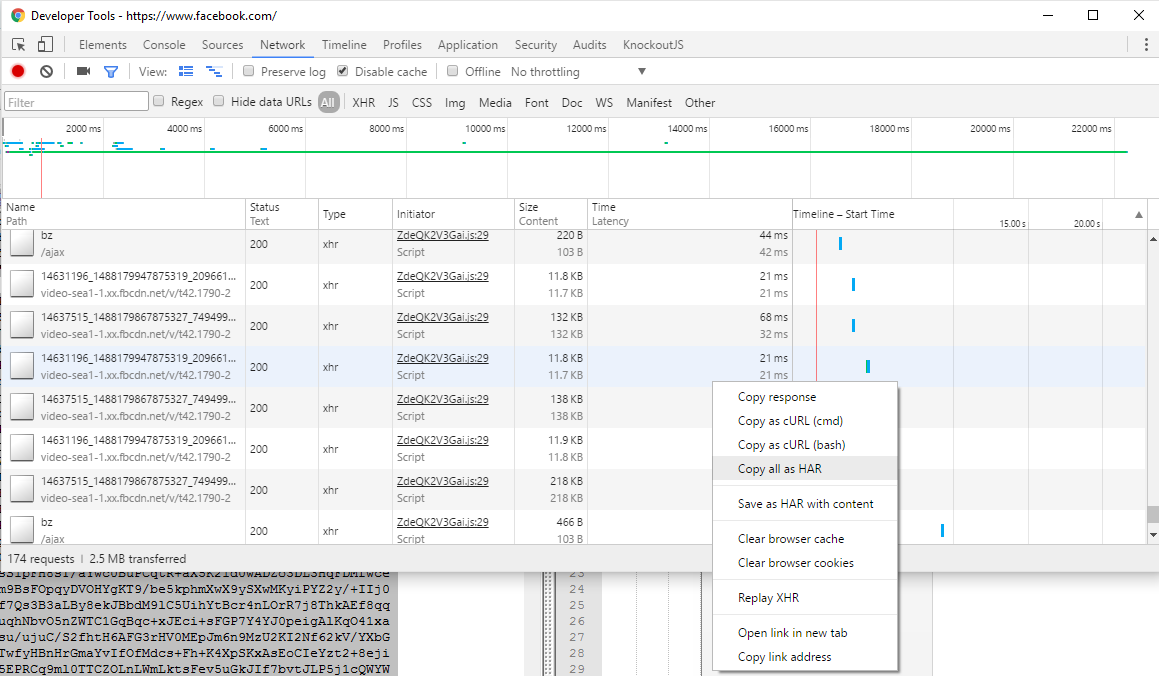
Today I had the need to do some simple network analysis to figure out if my site had issues, or the network. Chrome has a great network tab, but I wasn’t interested in individual requests. I poked around, but I couldn’t find anywhere to see the total average wait time, or the min or max. But I did notice an option to “copy all as HAR”

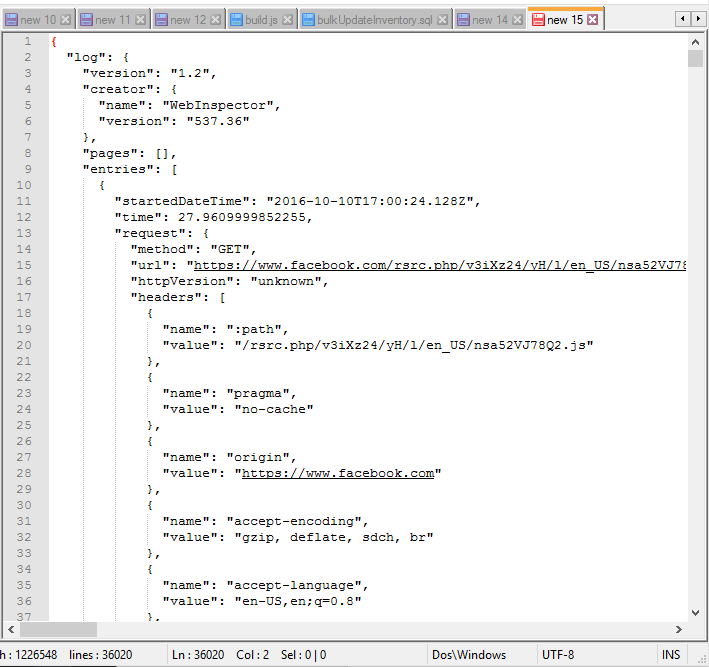
This format when pasted into notepad turned out to be JSON, happy dance :)

This gave me the idea to use MongoDB and a simple aggregation query to get my answers, and it worked awesome. First step was to simply import that HAL document into a collection. I used MongoChef, but you could just as easily save it to a file and use mongoimport.
Once I had the document in MongoDB, it was merely a matter of writing a simple aggregation query to get my answers, something like this
db.local.aggregate(
	// Pipeline
	[
		// Stage 1
		{
			$unwind: "$log.entries"
		},

		// Stage 2
		{
			$group: {_id: {_id: "$_id"},
			  averageWait : {
				$avg : "$log.entries.timings.wait"
				},
			  longestWait: {
			    $max: "$log.entries.timings.wait"
				},
			  shortestWait: {
			    $min: "$log.entries.timings.wait"
				},
			  averageReceive : {
				$avg : "$log.entries.timings.receive"
				},
			  longestReceive: {
			    $max: "$log.entries.timings.receive"
				},
			  shortestReceive: {
			    $min: "$log.entries.timings.receive"
				}
			}
		},

	]

	// Created with 3T MongoChef, the GUI for MongoDB - https://3t.io/mongochef

);
This gave me the values I was looking for in a result like this.
{
    "_id" : {
        "_id" : ObjectId("57fbbb932a489818f0ffb31f")
    },
    "averageWait" : 116.0295567020025,
    "longestWait" : 16766.984000045337,
    "shortestWait" : 1.43500004196539,
    "averageReceive" : 27.89588402001092,
    "longestReceive" : 219.2810000269676,
    "shortestReceive" : 0.2569999778643677
}
The HAL format has a decent amount of other values per request, I’m sure I will come up with many more uses in the future for quick stats. If you come up with any, I’d love to see them as well!
Happy coding,
Joshua